

Core Web Vitals for business sites: the field guide
LCP, INP and CLS are graded on real visitors at the 75th percentile, not on your MacBook with a Lighthouse tab open. What actually moves each metric on content and commerce sites, ranked by effort.
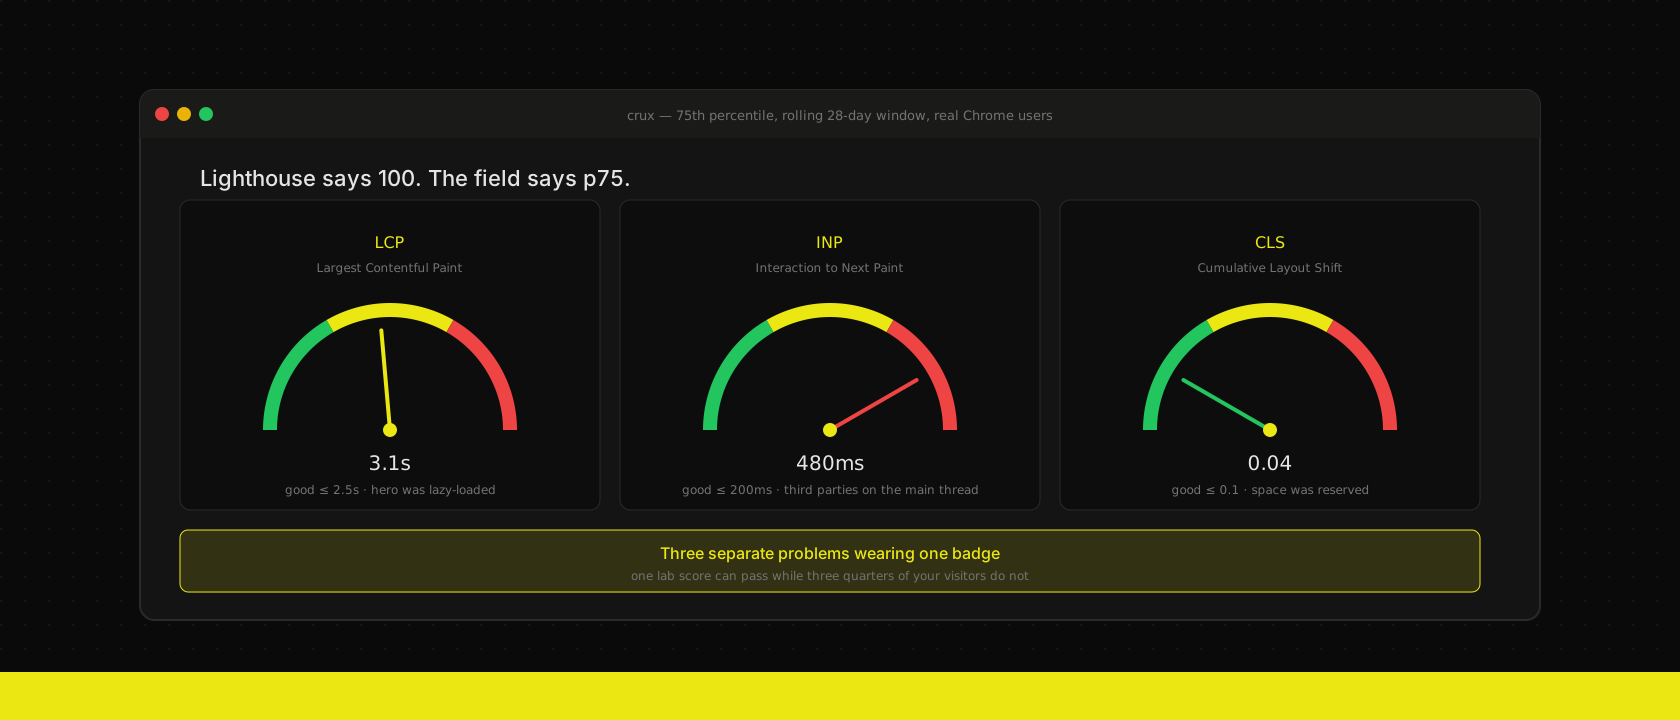
The conversation always starts the same way. A client sends a screenshot of Lighthouse showing 100 in every circle, next to a Search Console screenshot saying their URLs need improvement, and asks which one is lying. Neither is. They measure different things, and only one of them counts.
Lighthouse runs a simulated load on your machine, on your connection, with your CPU idle and your cache warm. Google's ranking signal comes from the Chrome User Experience Report — actual page loads from actual Chrome users who opted into reporting, aggregated at the 75th percentile over a rolling 28-day window. Three quarters of your visitors need a good experience for a URL to pass. The MacBook that produced the 100 is not in that sample, and the eight-year-old Android on 4G in a car park absolutely is.
That gap is the whole subject. Everything below is about closing it on the kind of site we build most: custom web applications with a public marketing layer, and headless storefronts where a slow first paint is a measurable revenue line.
The three metrics, and what actually breaks each one
The thresholds are unambiguous, which is refreshing — at p75, across a 28-day window:
| Metric | Good | Needs improvement | Poor |
|---|---|---|---|
| LCP — Largest Contentful Paint | ≤ 2.5s | ≤ 4.0s | > 4.0s |
| INP — Interaction to Next Paint | ≤ 200ms | ≤ 500ms | > 500ms |
| CLS — Cumulative Layout Shift | ≤ 0.1 | ≤ 0.25 | > 0.25 |
Three separate problems wearing one badge. Treating them as one "make the site faster" ticket is how teams spend a sprint shaving 40KB off a bundle and move nothing, because their failing metric was CLS caused by a cookie banner.
LCP is a discovery problem, not a bandwidth problem
On virtually every content or commerce site we audit, the largest contentful element is the hero image. And when LCP is bad, the cause is almost never the image's file size — it's when the browser found out the image existed.
The browser's preload scanner reads the raw HTML and starts fetching what it sees. Anything that only becomes visible after React renders, after a client component hydrates, or after a useEffect sets a state variable is invisible to that scanner. You've moved your most important byte behind your least important JavaScript.
import Image from "next/image"

// priority sets fetchPriority="high" AND emits a <link rel="preload">
// into the document head at render time — the scanner sees it immediately.
<Image src={hero} alt="" priority sizes="100vw" />
Three rules cover most of it:
- Never lazy-load the LCP element.
loading="lazy"on a hero image is the single most common self-inflicted LCP wound. Lazy-load everything below the fold; never the thing above it. - Serve it from a CDN with format negotiation. Ours emits AVIF/WebP at the requested width from the edge, so the phone gets a 40KB image and the 5K display gets the big one. Resizing at the origin means the phone downloads the desktop asset.
- Make sure it's in the initial HTML. If your hero renders client-side, no amount of image optimisation saves you. This is one of several reasons the marketing layer of a site should be statically rendered and the interactive layer should not be the same layer.
Then check the other half of LCP, which nobody looks at: time to first byte. If the server takes 900ms to answer, you have 1.6s left for everything else. Static pages served from memory answer in single-digit milliseconds; a page that hits an ERP synchronously does not. That split — static where it can be, cached where it can't — is a rendering-architecture decision, and it caps your LCP before a single image loads.
INP is the one that catches modern React
INP replaced FID in March 2024, and the replacement was not cosmetic. FID measured the delay before the browser started processing your first interaction — a number you could pass while shipping a genuinely unusable page. INP measures every interaction across the visit, from input to the next painted frame, and reports roughly the worst one.
That change made INP the metric that grades your JavaScript honestly, and it's where React-heavy business sites now fail. The usual suspects, in the order we find them:
- Hydration on pages that didn't need it. Every client component on a route costs main-thread time before anything responds. A services page with three interactive widgets shouldn't ship the JavaScript for a whole application shell.
- Third-party tags. Consent banners, chat widgets, tag managers, heatmap recorders. Each one is someone else's code on your main thread, and their performance budget is not your performance budget. We load analytics only after consent and only after the page is interactive — which is a GDPR requirement first and an INP win second.
- One long task doing everything. A click handler that filters 4,000 rows, re-sorts them and re-renders in a single synchronous block will blow past 200ms on a mid-range phone even when it feels instant on your laptop.
For that last one, the fix is to stop hogging the thread rather than to make the work faster:
// Yield between chunks so the browser can paint feedback
// instead of freezing until the whole batch is done.
for (const chunk of chunks(products, 200)) {
  applyFilter(chunk)
  if ("scheduler" in window) await scheduler.yield()
}
And check what you're rendering at all. On long listing pages, content-visibility: auto lets the browser skip layout and paint for off-screen sections entirely — one CSS line that regularly does more for INP than a week of memoisation.
.product-row {
  content-visibility: auto;
  /* Reserve space so skipping layout doesn't itself cause a shift. */
  contain-intrinsic-size: auto 180px;
}
CLS is a discipline problem
CLS is the cheapest of the three to fix and the most embarrassing to fail, because every cause is something a developer chose not to reserve space for.
- Images and video without dimensions. Set
widthandheight(or an aspect ratio) so the box exists before the bytes arrive.next/imagedoes this for you when you import a static asset; a raw<img>in MDX does not. - Web fonts swapping. A fallback font with different metrics reflows every paragraph when the real font lands.
next/fontgenerates a metric-matched fallback withsize-adjustautomatically — the swap becomes invisible instead of a full-page jump. - Anything injected late. Cookie banners, promo bars, "we use cookies" strips, A/B test variants. If it appears after paint and pushes content down, it is scored against you. Reserve the space in the initial layout, or overlay it instead of inserting it into the flow.
- Third-party embeds. Maps, video players and review widgets that size themselves after loading. Wrap them in a container with a fixed aspect ratio and accept a small letterbox.
Ranked by effort
If you only get one afternoon, this is the order we work in — highest ratio of metric movement to hours spent, first:
- Remove
loading="lazy"from the hero and addpriority. Minutes. Frequently the single largest LCP improvement available. - Reserve space for the cookie banner and any late widget. An hour. Usually takes CLS from failing to passing outright.
- Defer every third-party script until after consent and after interactive. An afternoon. Biggest single lever on INP, and it's a compliance improvement anyway.
- Static-render the marketing routes. A day or two if the architecture allows it. Fixes the TTFB half of LCP permanently, for every page at once.
- Audit which components genuinely need to be client components. Ongoing. The slow, real work — and the one that keeps INP good as the site grows.
- Micro-optimise bundle size. Last. It's the thing everyone starts with and it's rarely what's failing.
Measure your own field data — CrUX probably doesn't have you
Here's the part that catches Belgian SMEs specifically: CrUX only reports origins with enough qualifying traffic. A regional B2B site with a few thousand monthly visitors often has no CrUX data at all, or only origin-level data with no per-URL breakdown. PageSpeed Insights will happily show you a lab score and an empty field section, and the client reads that as "we're fine."
So collect it yourself. The web-vitals library reports the same metrics Chrome sends to CrUX, from every real visitor, with no traffic threshold:
"use client"
import { onCLS, onINP, onLCP } from "web-vitals/attribution"

// The attribution build tells you WHICH element caused it —
// without that you get a bad number and no address to send the fix to.
const report = (m: Metric) =>
  posthog.capture("web_vital", {
    name: m.name,
    value: m.value,
    rating: m.rating,
    target: m.attribution.largestShiftTarget ?? m.attribution.interactionTarget,
  })

onLCP(report)
onINP(report)
onCLS(report)
Use the /attribution build, not the plain one. "INP was 640ms" is a number. "INP was 640ms and the target was .filter-chip" is a ticket. Then watch your own p75, on your own dashboard, and stop waiting 28 days to find out whether last week's deploy helped.
What we actually do
We don't chase 100s. A perfect Lighthouse score on a page that takes 900ms to answer from the origin is a decorative number. What we do instead: render marketing pages statically so TTFB is never the problem, put media on a CDN that negotiates format and size at the edge, keep interactivity confined to the components that need it, hold third parties behind consent, and instrument real visitors so the p75 we're arguing about is ours and not a simulation.
That's not a performance sprint. It's a set of defaults that make the field data good before anyone measures it — which is the only version of this that survives the next six months of feature work.
Want us to publish something specific?
Tell us what you'd like to read and we'll add it to our writing queue.
Get the next one in your inbox
New articles, videos and the occasional engineering note — a short mail when there’s something worth reading, nothing else.