

Right-sizing Kubernetes: requests and limits without the guesswork
Overprovision and you pay for idle cores; underprovision and the OOM killer visits at month-end close. How we set requests and limits from real usage percentiles instead of round numbers that sounded right.
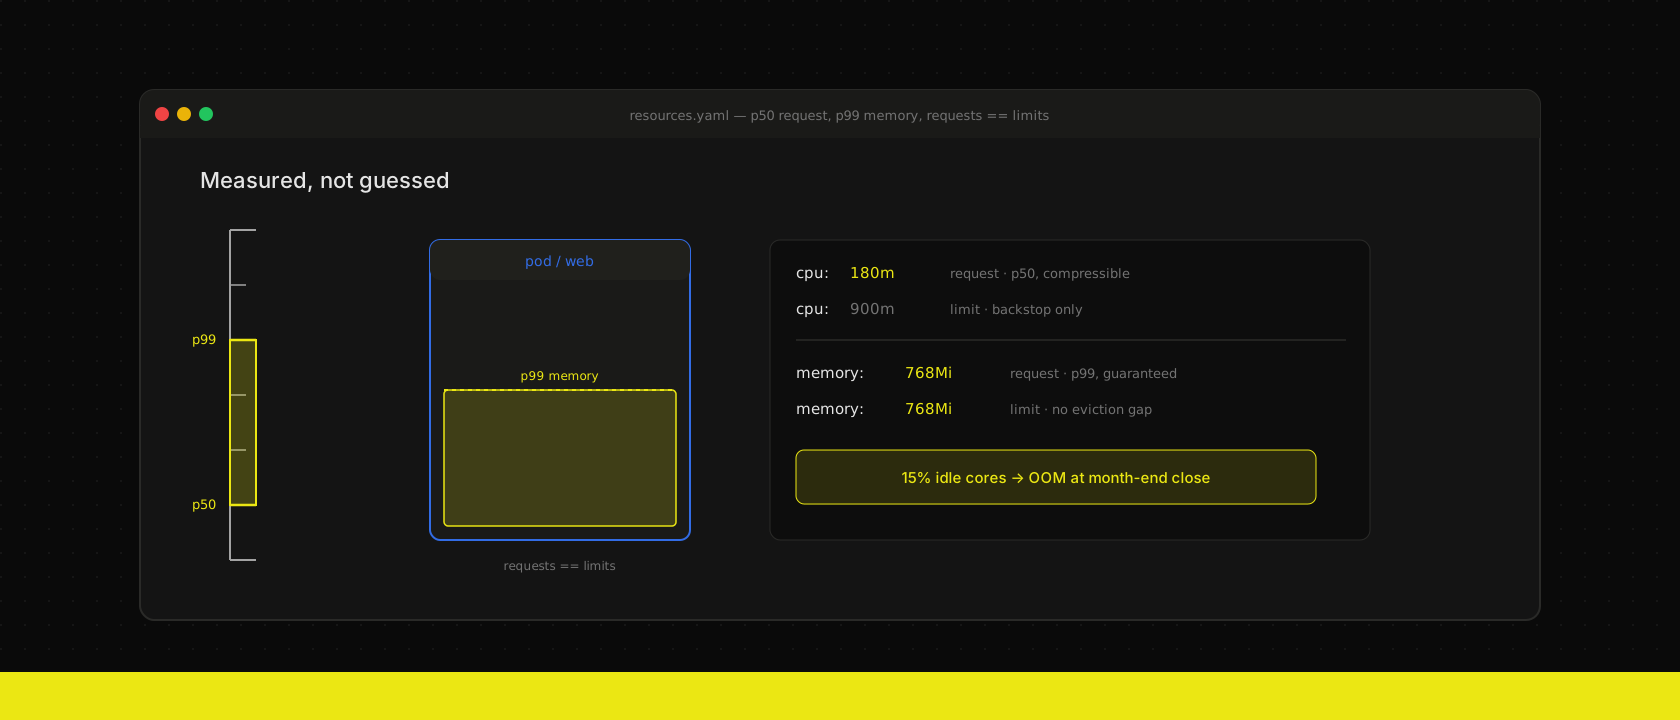
Every cluster we inherit has the same fingerprint: a resources block someone typed once, under deadline, and nobody has touched since. cpu: 500m, memory: 512Mi — not because anyone measured anything, but because it looked like a sensible middle ground. Multiply that guess across forty deployments and you get a cluster that's simultaneously over-provisioned (idle cores you're still paying for) and under-provisioned (the one workload that actually needs 1.5Gi gets OOM-killed the one day it matters). Both audits — FinOps asking why utilization sits at 15%, and the on-call engineer asking why checkout died at month-end close — trace back to the same root cause: nobody ever looked at what the pod actually uses.
Stop guessing, start querying
The data already exists; it's just sitting in Prometheus instead of anyone's head. Before touching a single manifest, pull two weeks of real usage per container:
quantile_over_time(0.95,
  rate(container_cpu_usage_seconds_total{container="web"}[5m])[14d:5m]
) by (pod)quantile_over_time(0.99,
container_memory_working_set_bytes{container="web"}[14d:1h]
) by (pod)Two weeks is the minimum — shorter windows miss the batch job that runs every other Monday, or the traffic spike from a newsletter send. If you don't already scrape kube-state-metrics and cAdvisor, the Vertical Pod Autoscaler recommender does the same percentile math for you, in updateMode: "Off" so it only reports rather than evicts:
apiVersion: autoscaling.k8s.io/v1
kind: VerticalPodAutoscaler
metadata:
  name: web-vpa
spec:
  targetRef:
    apiVersion: apps/v1
    kind: Deployment
    name: web
  updateMode: "Off"
kubectl describe vpa web-vpa then prints target, lower-bound and upper-bound recommendations per container — read them, don't automate on them yet.
CPU requests, memory requests: not the same rule
The two numbers get set from the same percentile data, but they answer different questions, and treating them identically is where most of the bad defaults come from.
CPU is compressible. A pod over its CPU limit doesn't die, it gets throttled by the kernel's CFS bandwidth controller — slower responses, not an outage. That makes the request the number that matters: it's what the scheduler uses to place the pod and what guarantees a floor under contention. We set CPU requests at the p50 of real usage, not p95 — a request that high wastes bin-packing headroom for a burst the pod only hits occasionally. We skip a hard CPU limit entirely on latency-sensitive tiers, or set it generously (4-5x the request) purely as a runaway-process backstop, because a limit that's too tight just throttles legitimate traffic spikes.
Memory is not compressible. There's no throttling equivalent — a container over its memory limit gets OOM-killed, full stop, and that's a request timeout or a dropped connection, not a graceful slowdown. So memory requests get sized off p99, with headroom for the worst day you measured, and — this is the one we don't compromise on — requests equal limits. Anything else is asking to be picked first when the node runs low, and Kubernetes obliges: pods with requests < limits on memory get Burstable QoS, which is evicted before Guaranteed pods every time. This is the exact rule we apply to CloudNativePG database pods — a stateful workload evicted mid-transaction is a worse day than a slightly bigger node.
resources:
  requests:
    cpu: "180m"      # p50 CPU usage
    memory: "768Mi"  # p99 memory usage, requests == limits
  limits:
    cpu: "900m"      # backstop, not a throttling target
    memory: "768Mi"
The two audits it has to survive
Right-sizing isn't done when the YAML compiles — it's done when it holds up against the two people who will eventually ask about it.
- The cost audit. Someone in finance asks why the cluster bill hasn't moved despite "removing three services." Node utilization sitting at 15-20% CPU request-vs-usage is the tell — every one of those idle-reserved cores is billed whether a pod ever calls on it or not. The fix isn't a smaller node type, it's requests that reflect p50 usage instead of a guess, which lets the scheduler actually bin-pack.
- The reliability audit. Someone from on-call asks why three pods got OOM-killed during Friday's month-end invoice run. This is almost always a memory request set from a quiet Tuesday afternoon, not from the batch job that runs once a month and briefly needs 3x the baseline. p99 over a window long enough to catch the periodic spike is the fix, not "add more replicas" — more replicas of an under-provisioned pod is still under-provisioned.
Both audits get satisfied by the same input data, measured honestly, which is the whole point — right-sizing is not a tradeoff between cost and reliability, it's what removes the guesswork that was causing both problems at once.
Where this doesn't help
Right-sizing static requests solves the "someone guessed a number" problem. It doesn't solve the "traffic varies 5x across the day" problem — that's what Horizontal Pod Autoscaler is for, and the two are complementary, not competing: size the request correctly per-pod, then let HPA change how many pods there are. Running VPA in Auto mode against the same metric an HPA already scales on is the one combination to avoid — both controllers reacting to the same CPU signal fight each other, and VPA's habit of evicting to resize makes that fight visible to users. Recommend with VPA, act on it deliberately, autoscale replica count separately.
Re-run the percentile query after every feature release that changes what a pod does under the hood — a resource footprint measured against last quarter's code is just next quarter's incident. We run this as a standing check on every cluster we operate, not a one-time exercise before launch.
Want us to publish something specific?
Tell us what you'd like to read and we'll add it to our writing queue.
Get the next one in your inbox
New articles, videos and the occasional engineering note — a short mail when there’s something worth reading, nothing else.