

Self-hosted observability: metrics and alerts without the SaaS bill
SaaS observability bills scale with pod count, not with incidents. The VictoriaMetrics + Grafana stack we run in every cluster we operate, and the alerting rule that matters more than the dashboard.
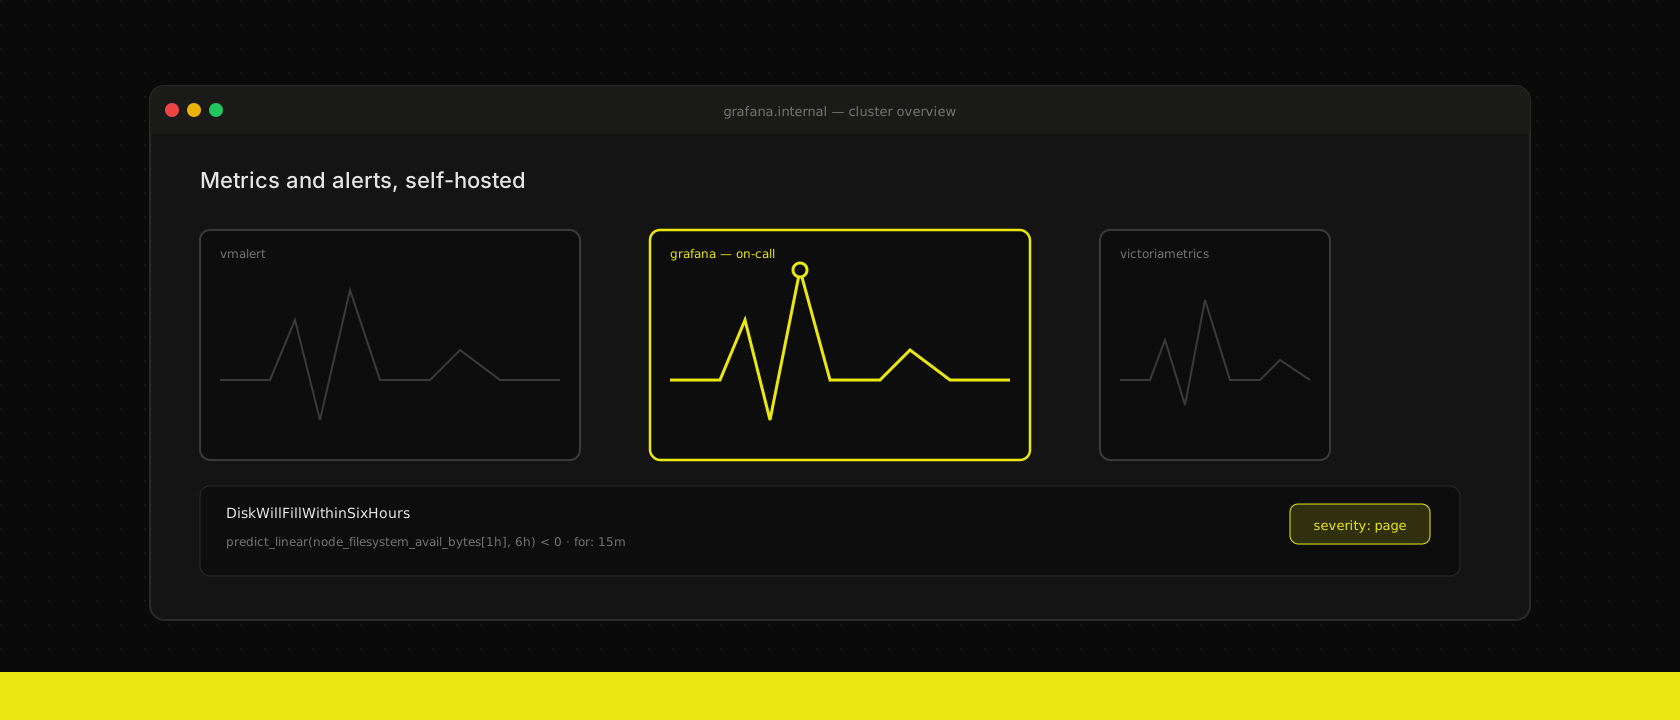
Every hosted-metrics vendor prices the same way: per active series, per host, per ingested sample. That model is fine for ten pods. It stops being fine somewhere around the point a cluster grows past a hundred, because the bill grows with cardinality, not with how many incidents the stack actually helped you catch. We've seen quotes that would cost more per month than the compute they were monitoring. So every cluster we operate runs the same self-hosted stack instead: VictoriaMetrics for storage, Grafana for dashboards, vmalert for rules — and we own the retention, the cardinality, and the bill.
Why VictoriaMetrics instead of Prometheus
Prometheus is the reference implementation and we still run it as the scraper on smaller projects. Where it runs out of road is long-retention, high-cardinality clusters — its local TSDB was never built to be a multi-tenant, horizontally-scalable store, and single-node Prometheus either falls over on cardinality or forces you into a federation setup nobody enjoys operating.
VictoriaMetrics is a drop-in replacement for the parts that matter: it speaks the Prometheus remote-write protocol, PromQL works unmodified, and vmagent scrapes the exact same ServiceMonitor and PodMonitor CRDs the Prometheus Operator already uses. Migrating is a storage-backend swap, not a rewrite of every alert and dashboard we've already built:
apiVersion: operator.victoriametrics.com/v1beta1
kind: VMAgent
metadata:
  name: vmagent
spec:
  serviceScrapeSelector: {}
  podScrapeSelector: {}
  remoteWrite:
    - url: "http://vmsingle-vm.monitoring.svc:8429/api/v1/write"
On the clusters we've migrated, disk usage for the same retention window dropped to roughly a third of what Prometheus needed, purely from VictoriaMetrics' columnar storage and better compression. That's not a marginal win — it's the difference between affording 13 months of retention (useful for year-over-year capacity planning) and being forced to prune to 15 days.
Alerts that page a human only when a human can act
The stack we described in right-sizing Kubernetes already pulls percentile data out of the same metrics store — observability isn't a separate concern from capacity planning, it's the same time-series data answering a different question. The failure mode we actively design against is alert fatigue: a rule set that fires on every blip trains the on-call engineer to mute the channel, and a muted channel is worse than no alerting at all.
Every vmalert rule we ship has to answer one question before it merges: if this fires at 3 AM, is there an action a human can actually take right now? "Disk 80% full, will hit 100% in six hours" passes — there's time to act and a clear fix. "CPU spiked for 90 seconds" does not — nobody can do anything useful with that at 3 AM, and it belongs on a dashboard, not in a page.
groups:
  - name: node-disk
    rules:
      - alert: DiskWillFillWithinSixHours
        expr: |
          predict_linear(node_filesystem_avail_bytes{mountpoint="/data"}[1h], 6*3600) < 0
        for: 15m
        labels:
          severity: page
        annotations:
          summary: "{{ $labels.instance }} disk predicted to fill within 6h"
predict_linear over a one-hour window, evaluated for 15 minutes before it fires, filters out the noise a static threshold would catch on every backup job's temporary spike. The for: 15m is doing as much work as the query itself — it's the difference between a transient blip and a trend worth waking someone for.
One dashboard per audience, not one dashboard for everyone
Grafana makes it easy to build a single "everything" dashboard, and every team eventually does, and then nobody reads it because it takes ninety seconds to find the panel that matters during an incident. We split by audience instead: an on-call dashboard (error rate, saturation, the four golden signals, nothing else), a capacity dashboard (the percentile queries from our right-sizing work, refreshed daily, not real-time), and a per-client dashboard for teams with a support agreement who want visibility into their own instance without ERP-level access.
Application-level errors are a separate signal from infrastructure metrics, and we keep them in a separate tool on purpose — the traceback-and-context detail Sentry or GlitchTip captures doesn't belong in a time-series database, and infrastructure saturation doesn't belong in an error tracker. VictoriaMetrics and Grafana answer "is the system healthy," GlitchTip answers "what exactly broke and for whom" — conflating the two into one dashboard just makes both harder to read.
Where self-hosting doesn't pay off
This isn't free — someone has to run vmalert's rule reviews, keep Grafana's dashboards from rotting into noise, and own the on-call rotation the SaaS vendor used to abstract away. For a single small service with light traffic, a hosted free tier is genuinely the right call; the operational overhead of running your own stack isn't worth it below a certain scale. The break-even is roughly where cardinality-based SaaS pricing starts hurting more than an engineer-hour a month of stack maintenance — which, on every cluster we've measured, is well before a hundred pods.
Self-hosted observability isn't a cost-cutting trick we apply everywhere by default. It's what we run on every cluster we host once the workload is big enough that the bill would otherwise scale with cardinality instead of with the incidents it actually catches.
Want us to publish something specific?
Tell us what you'd like to read and we'll add it to our writing queue.
Get the next one in your inbox
New articles, videos and the occasional engineering note — a short mail when there’s something worth reading, nothing else.